Post Views: 22
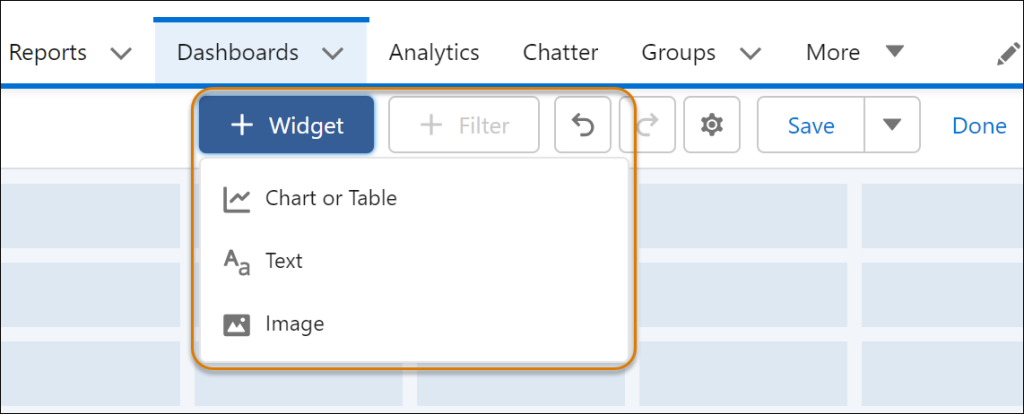
1. You can now explain charts, describe metrics and KPIs, clarify tables, add company logos and branding, or embed images directly into your #dashboards.
2. You can use section titles, descriptive text, and animated GIFs to guide users through the data.
3. Dashboards can now hold 25 widgets, allowing for 20 charts/tables, 2 images, and 25 rich text widgets.
This makes it easier to organize and present your data visually and engagingly. Give it a try!

References & Useful URLs
For Related Spring’24 Release Note Article visit: Click Here